Monitoring ClickHouse on Kubernetes
Now that you have your first ClickHouse instance on Kubernetes and are starting to use it, monitoring and observing what happens on it is an important task to achieve stability and optimal performance.
In this guide, you'll learn about:
- Built-in advanced observability dashboard
- Setting up Prometheus + Grafana for metrics visualization
- Leveraging ClickHouse system tables for deep insights
- Using ClickHouse Monitoring UI for simplified management
There are several effective approaches to monitoring ClickHouse:
- Built-in dashboard
- Export metrics to Prometheus and visualize them with Grafana
- ClickHouse Monitoring UI that relies on powerful system tables
1. Built-in advanced observability dashboard
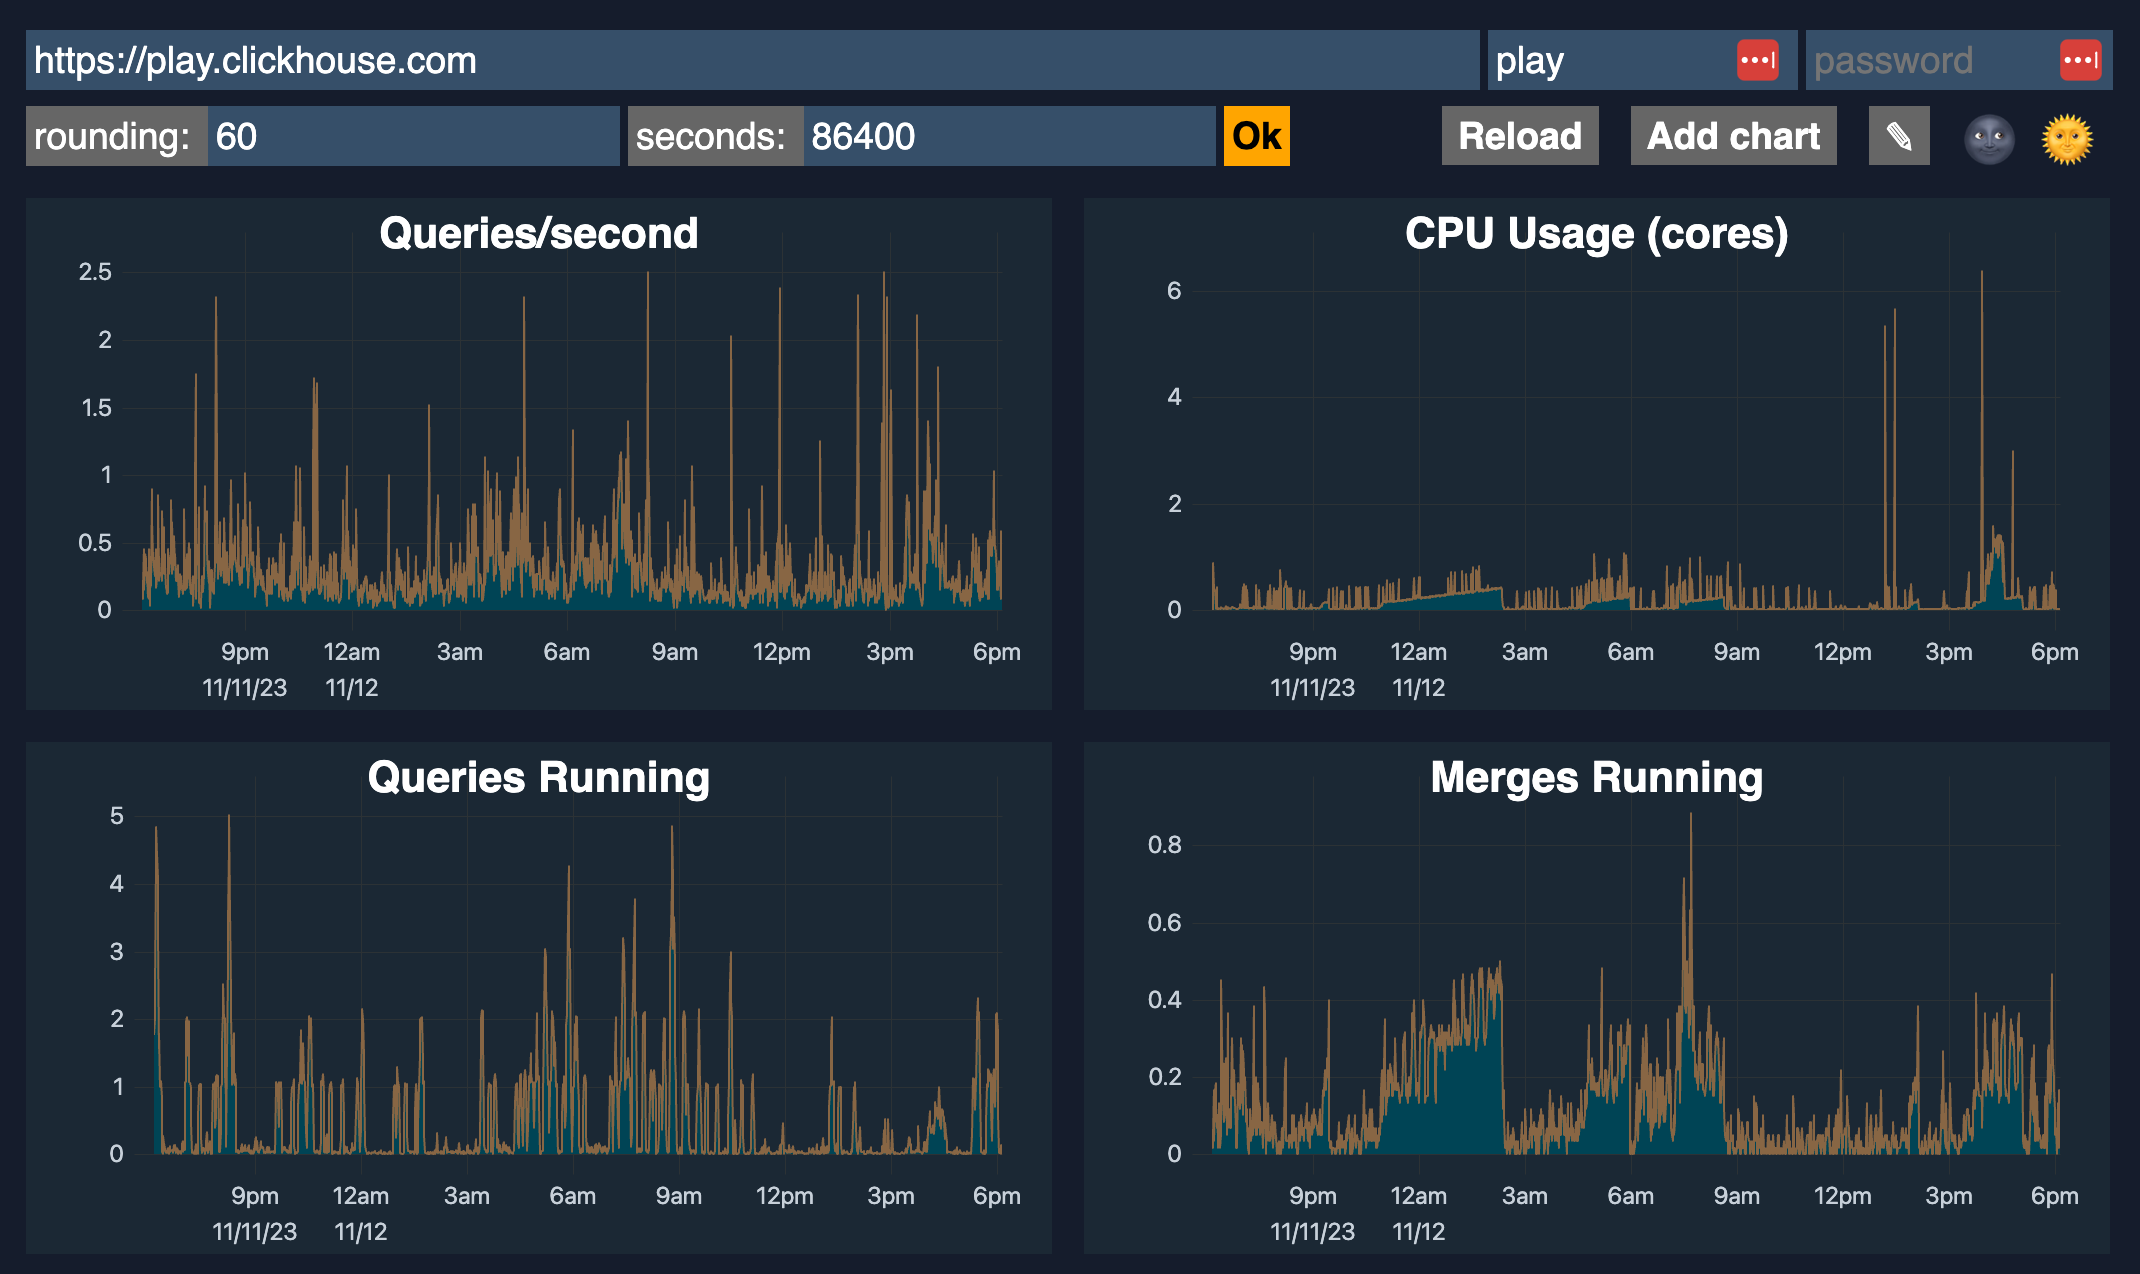
ClickHouse includes an advanced observability dashboard feature accessible at $HOST:$PORT/dashboard (login required).
It displays metrics such as Queries/second, CPU usage, Queries running, Merges running, Selected bytes/second, IO wait, CPU, Read/Write, Inserted rows/second, Total MergeTree parts, and Max parts for partition, etc.
2. Monitoring with Prometheus + Grafana
You can configure ClickHouse to export metrics to Prometheus. ClickHouse Operator do have a section for this:
- Step 1: Setup Prometheus pool data from ClickHouse into Prometheus
- Step 2: Setup Grafana
They also have a dashboard for ClickHouse Operator Dashboard so you can just need to import it:
- Altinity_ClickHouse_Operator_dashboard.json
- ClickHouse_Queries_dashboard.json
- ClickHouseKeeper_dashboard.json
References:
- ClickHouse Grafana plugin 4.0 - Leveling up SQL Observability
- A Story of Open-source GitHub Activity using ClickHouse + Grafana
- Video: Visualizing ClickHouse Data with Grafana
- Visualizing Data with ClickHouse - Part 1 - Grafana
3. ClickHouse system tables
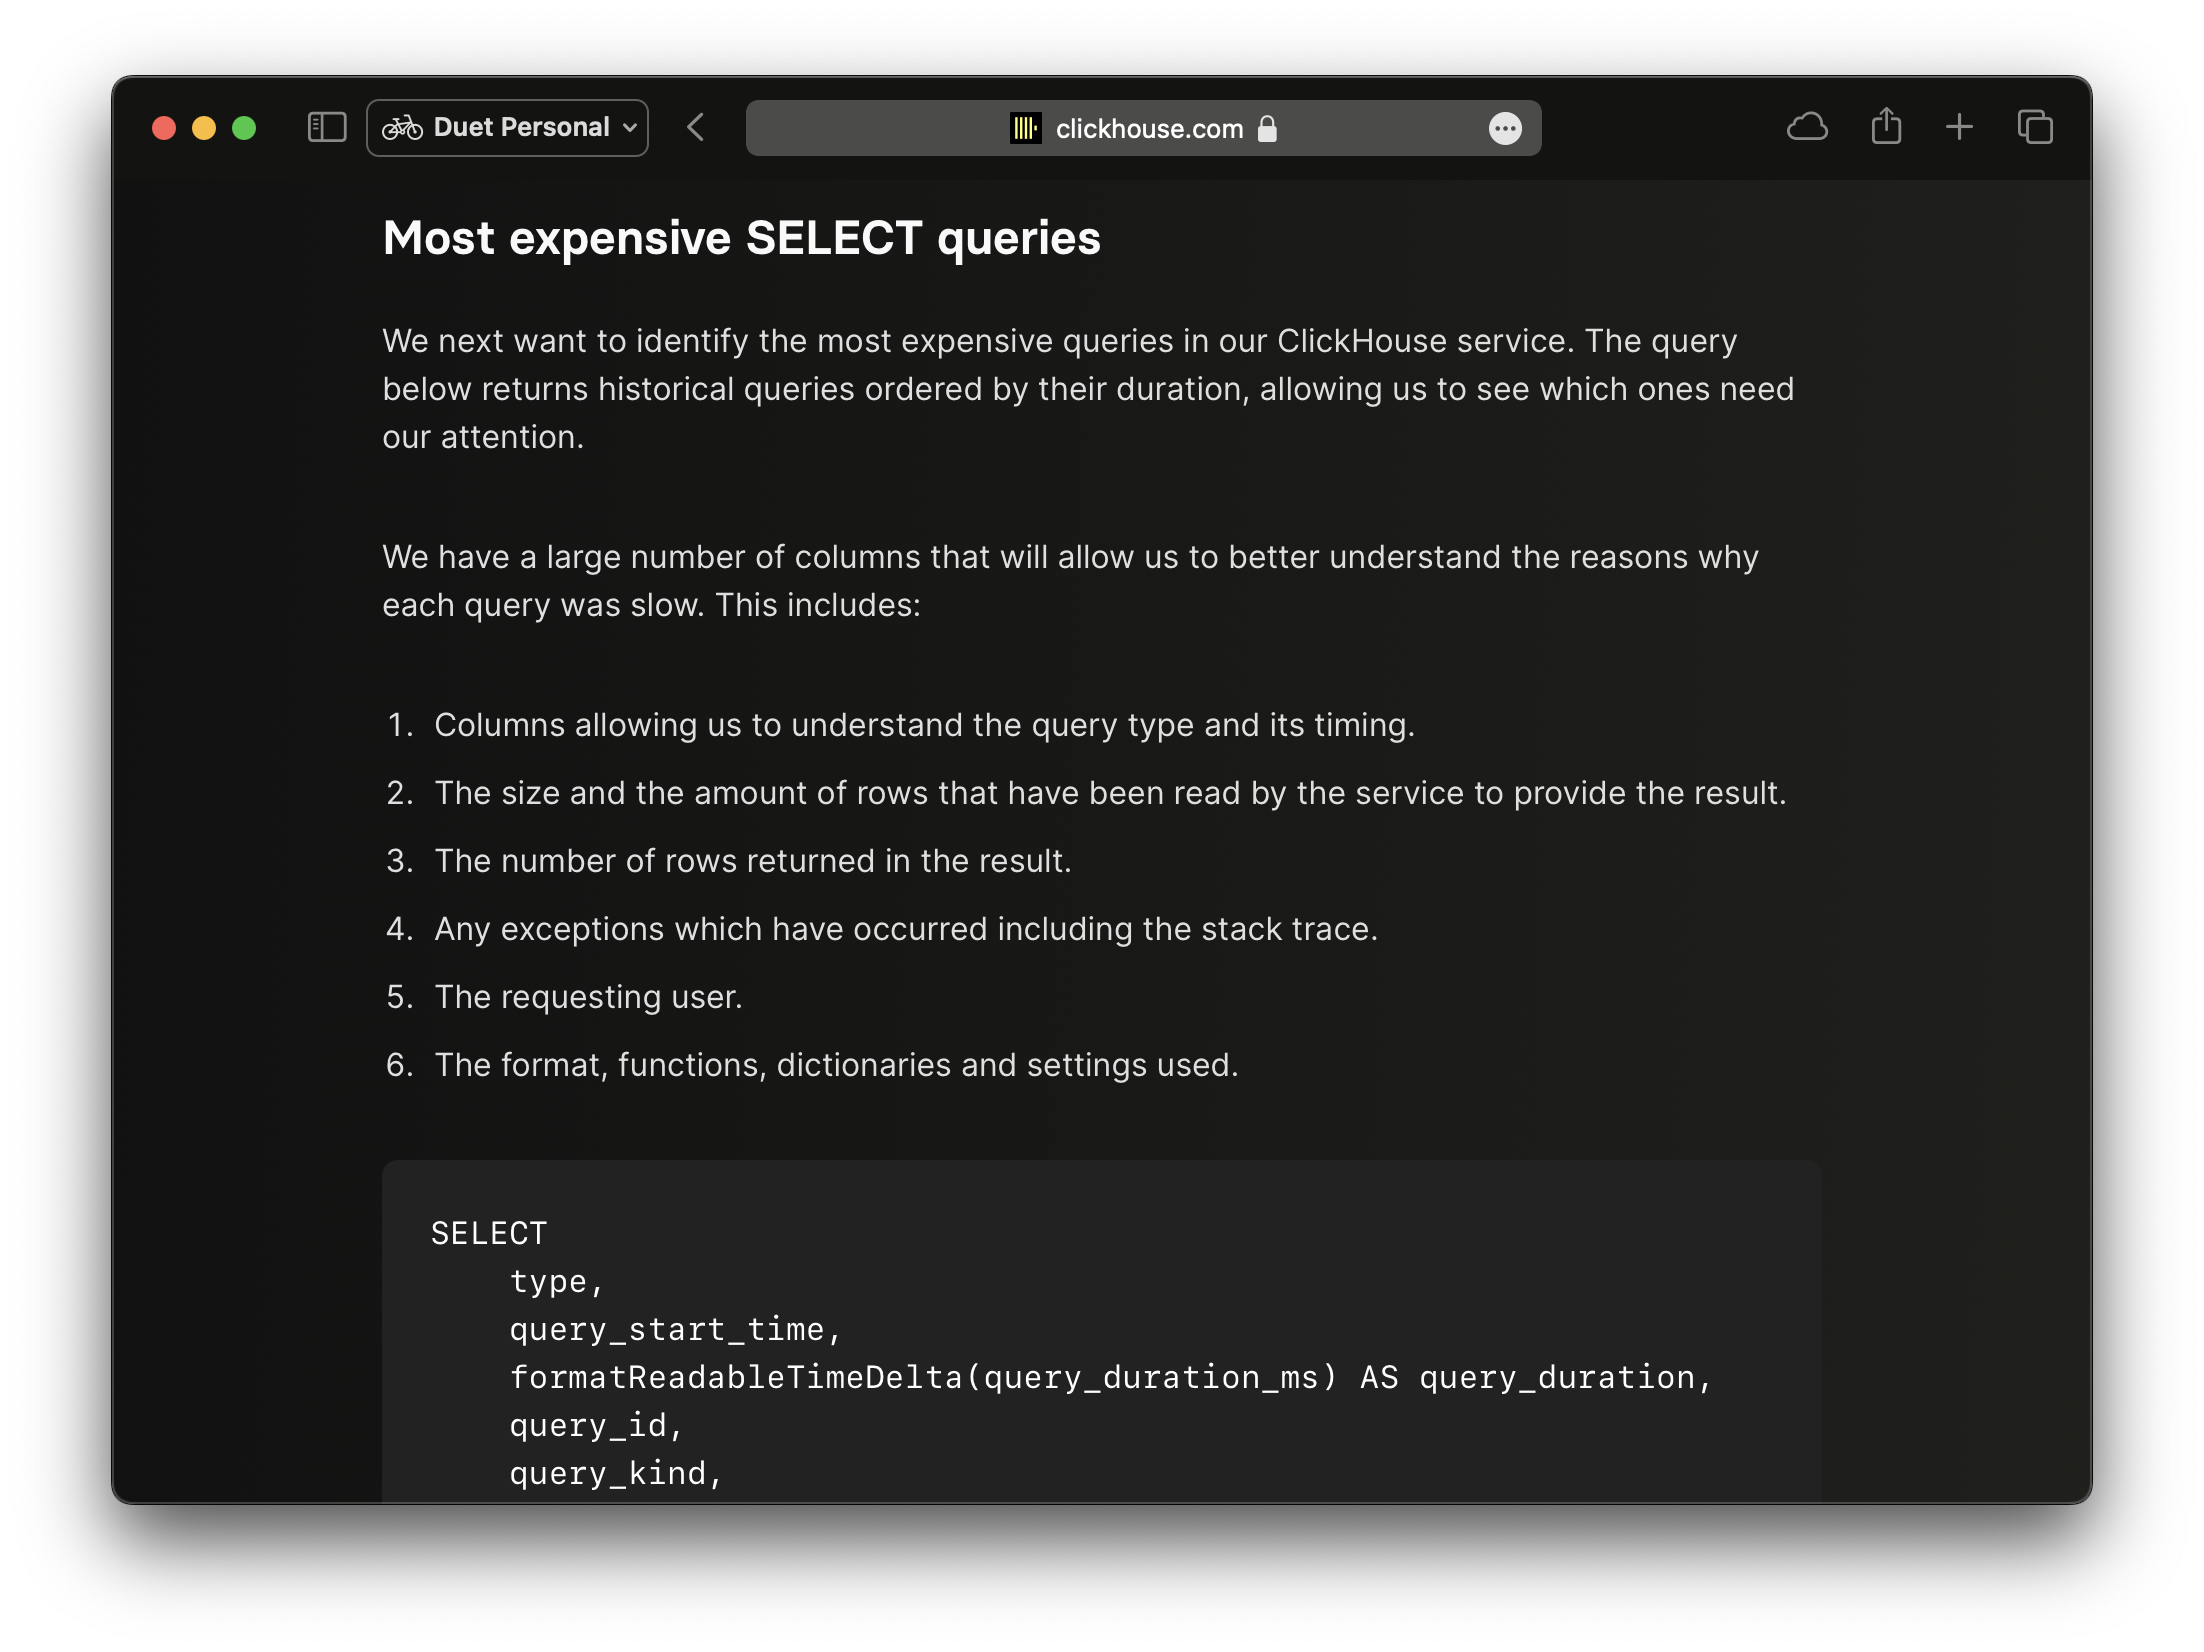
You should read these blog post by ClickHouse about rely on the system tables to get more insights about running queries and their performance. These contains about some topic like for example: most expensive SELECT queries, average query duration and number of requests, number of SQL queries by client or user, etc.
- Essential Monitoring Queries - part 1 - INSERT Queries
- Essential Monitoring Queries - part 2 - SELECT Queries
4. ClickHouse Monitoring UI Dashboard
This is my simple monitoring dashboard for ClickHouse, built with Next.js for monitoring all my clusters. It relies on system tables above that provide rich information. A live demo is available at: https://clickhouse-monitoring.vercel.app/


You can install it into Kubernetes via the latest helm chart here: https://github.com/duyet/charts/tree/master/clickhouse-monitoring
helm repo add duyet https://duyet.github.io/charts

cat <<EOF >> values.yaml
env:
  - name: CLICKHOUSE_HOST
    value: http://clickhouse-single.clickhouse.svc:8123
  - name: CLICKHOUSE_USER
    value: monitoring
  - name: CLICKHOUSE_PASSWORD
    value: ''
EOF

helm install -f values.yaml clickhouse-monitoring-release duyet/clickhouse-monitoring
Summary and Best Practices
Effective monitoring is crucial for maintaining a healthy ClickHouse cluster. Let's recap the key monitoring strategies and best practices:
Monitoring Approaches Comparison
| Approach | Pros | Cons | Best For |
|---|---|---|---|
| Built-in Dashboard | ✅ No setup required ✅ Real-time metrics ✅ Lightweight |
❌ Basic features ❌ No historical data ❌ Single instance view |
Quick health checks, Development |
| Prometheus + Grafana | ✅ Industry standard ✅ Extensive customization ✅ Alerting support ✅ Long-term storage |
❌ Complex setup ❌ Resource intensive ❌ Requires expertise |
Production environments, Large clusters |
| System Tables | ✅ Most detailed insights ✅ SQL-based queries ✅ No external deps |
❌ Manual querying ❌ No visualization ❌ Requires SQL knowledge |
Debugging, Performance tuning |
| Monitoring UI | ✅ Easy to use ✅ Multiple clusters ✅ Quick deployment |
❌ Limited customization ❌ Community tool |
Small to medium clusters, Quick setup |
Key Metrics to Monitor
Performance Metrics:
- 📊 Queries per second (QPS) - Request throughput
- ⏱️ Query duration - P50, P90, P99 latencies
- 💾 Memory usage - Per query and cluster-wide
- 🔄 CPU utilization - Query processing load
- 📝 Merge activity - Background operations health
Operational Metrics:
- 🗂️ MergeTree parts - Data organization efficiency
- 📦 Disk usage - Storage capacity tracking
- 🔌 Connections - Active client connections
- ⚠️ Failed queries - Error rate monitoring
- 🔄 Replication lag - For replicated setups
Critical System Tables:
system.query_log- Query history and performancesystem.processes- Currently running queriessystem.merges- Merge operations statussystem.replication_queue- Replication healthsystem.parts- Table parts informationsystem.metrics- Real-time metricssystem.asynchronous_metrics- Periodic metrics
Essential Monitoring Queries
Find slow queries:
SELECT
    query_duration_ms,
    query,
    user,
    query_start_time
FROM system.query_log
WHERE type = 'QueryFinish'
  AND query_duration_ms > 10000
ORDER BY query_duration_ms DESC
LIMIT 10
Check current running queries:
SELECT
    elapsed,
    query,
    user,
    memory_usage
FROM system.processes
ORDER BY elapsed DESC
Monitor disk usage:
SELECT
    database,
    table,
    formatReadableSize(sum(bytes)) AS size
FROM system.parts
WHERE active
GROUP BY database, table
ORDER BY sum(bytes) DESC
LIMIT 20
Production Recommendations
1. Implement Multi-Layer Monitoring:
- Use Prometheus + Grafana for real-time metrics and alerting
- Keep system tables accessible for deep debugging
- Deploy Monitoring UI for quick cluster overview
2. Set Up Alerting:
- High query error rate (> 1%)
- Memory usage > 80%
- Disk usage > 85%
- Too many table parts (> 300 per partition)
- Replication lag > 5 minutes
- Query duration spikes
3. Regular Health Checks:
- Daily: Review slow query log
- Weekly: Analyze query patterns and optimize
- Monthly: Capacity planning review
- Quarterly: Performance benchmarking
4. Documentation:
- Maintain runbooks for common issues
- Document baseline metrics for your workload
- Keep track of configuration changes
- Share monitoring dashboards with team
5. Continuous Improvement:
- Regularly review and update alert thresholds
- Add custom metrics for business-specific KPIs
- Optimize queries based on monitoring insights
- Scale infrastructure proactively based on trends
Next Steps
Now that you have monitoring in place:
- Explore ReplicatedReplacingMergeTree for high availability
- Learn about query optimization techniques
- Implement backup and disaster recovery
- Set up proper access control and security
Remember: Good monitoring is not just about collecting metrics—it's about understanding your system's behavior and making informed decisions to maintain performance and reliability.
Resources
Series: ClickHouse on Kubernetes
Complete guide to deploying ClickHouse on Kubernetes using the Altinity ClickHouse Operator. Learn how to set up your first single-node cluster, configure persistent storage, manage users, and customize ClickHouse versions. Includes practical examples and best practices from production experience managing clusters with trillions of rows.
Dynamic column selection (also known as a `COLUMNS` expression) allows you to match some columns in a result with a re2 regular expression.
Complete guide to monitoring ClickHouse on Kubernetes. Learn about built-in dashboards, Prometheus + Grafana setup, powerful system tables for monitoring queries, and the ClickHouse Monitoring UI dashboard. Includes practical examples, essential monitoring queries, and best practices for production observability.
After starting this series ClickHouse on Kubernetes, you can now configure your first single-node ClickHouse server. Let's dive into creating your first table and understanding the basic concepts behind the ClickHouse engine, its data storage, and some cool features
My favorite ClickHouse table engine is `ReplacingMergeTree`. The main reason is that it is similar to `MergeTree` but can automatically deduplicate based on columns in the `ORDER BY` clause, which is very useful.
Learn how to set up and manage ReplicatedReplacingMergeTree in ClickHouse on Kubernetes. This comprehensive guide covers cluster setup with ClickHouse Operator, data replication, performance tuning, and best practices for high availability deployments.