Python - Churn prediction with Graphlab
Note: This post is over 9 years old. The information may be outdated.
Churn prediction is the task of identifying whether users are likely to stop using a service, product, or website. With Graphlab toolkit, you can start with raw (or processed) usage metrics and accurately forecast the probability that a given customer will churn.
Note (2025): Graphlab has been deprecated and was succeeded by Turi Create. For modern churn prediction, consider using scikit-learn, TensorFlow, or PyTorch instead. This article is kept for historical reference.
Introduction
A churn predictor model learns historical user behavior patterns to make an accurate forecast for the probability of no activity in the future (defined as churn).
How is churn defined?
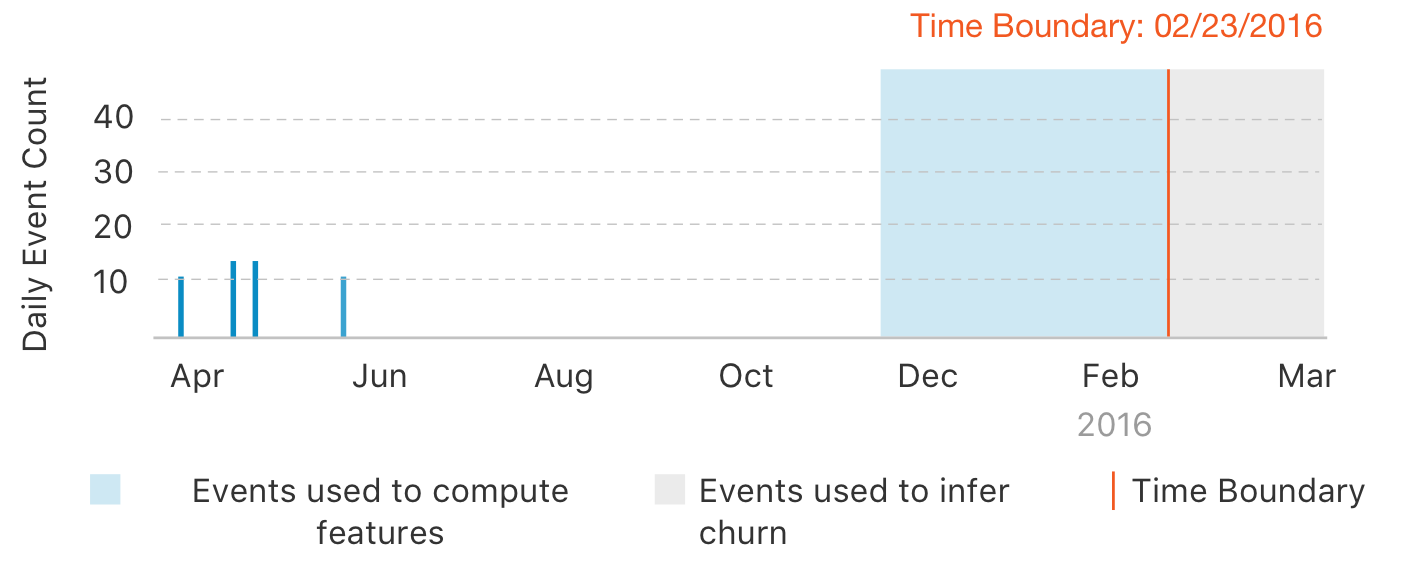
Customer churn can be defined in many ways. In this toolkit, churn is defined to be no activity for a fixed period of time (called the churn_period). Using this definition, a user is said to have churned if there is no activity for a duration of time known as the churn_period (by default, this is set to 30 days). The following figure better illustrates this concept.
Input Data
In the dataset, let us assume that the last timestamp was October 1,
+---------------------+------------+----------+
|     InvoiceDate     | CustomerID | Quantity |
+---------------------+------------+----------+
| 2010-12-01 08:26:00 |   17850    |    6     |
| 2010-12-01 08:26:00 |   17850    |    6     |
| 2010-12-01 08:26:00 |   17850    |    8     |
| 2010-12-01 08:26:00 |   17850    |    6     |
| 2010-12-01 08:26:00 |   17850    |    6     |
| 2010-12-01 08:26:00 |   17850    |    2     |
| 2010-12-01 08:26:00 |   17850    |    6     |
| 2010-12-01 08:28:00 |   17850    |    6     |
| 2010-12-01 08:28:00 |   17850    |    6     |
| 2010-12-01 08:34:00 |   13047    |    32    |
| 2010-12-01 08:34:00 |   13047    |    6     |
| 2010-12-01 08:34:00 |   13047    |    6     |
| 2010-12-01 08:34:00 |   13047    |    8     |
| 2010-12-01 08:34:00 |   13047    |    6     |
| 2010-12-01 08:34:00 |   13047    |    6     |
| 2010-12-01 08:34:00 |   13047    |    3     |
| 2010-12-01 08:34:00 |   13047    |    2     |
| 2010-12-01 08:34:00 |   13047    |    3     |
| 2010-12-01 08:34:00 |   13047    |    3     |
| 2010-12-01 08:34:00 |   13047    |    4     |
+---------------------+------------+----------+
[532618 rows x 5 columns]
If the churn_period is set to 1 month, a churn forecast predicts the probability that a user will have no activity for a 1 month period after October 1, 2011.
