PySpark Getting Started
Note: This post is over 11 years old. The information may be outdated.
Hadoop is the standard tool for distributed computing across really large data sets and is the reason why you see "Big Data" on advertisements as you walk through the airport. It has become an operating system for Big Data, providing a rich ecosystem of tools and techniques that allow you to use a large cluster of relatively cheap commodity hardware to do computing at supercomputer scale. Two ideas from Google in 2003 and 2004 made Hadoop possible: a framework for distributed storage (The Google File System), which is implemented as HDFS in Hadoop, and a framework for distributed computing (MapReduce).
These two ideas have been the prime drivers for the advent of scaling analytics, large scale machine learning, and other big data appliances for the last ten years! However, in technology terms, ten years is an incredibly long time, and there are some well-known limitations that exist, with MapReduce in particular. Notably, programming MapReduce is difficult. You have to chain Map and Reduce tasks together in multiple steps for most analytics. This has resulted in specialized systems for performing SQL-like computations or machine learning. Worse, MapReduce requires data to be serialized to disk between each step, which means that the I/O cost of a MapReduce job is high, making interactive analysis and iterative algorithms very expensive; and the thing is, almost all optimization and machine learning is iterative.
To address these problems, Hadoop has been moving to a more general resource management framework for computation, YARN (Yet Another Resource Negotiator). YARN implements the next generation of MapReduce, but also allows applications to leverage distributed resources without having to compute with MapReduce. By generalizing the management of the cluster, research has moved toward generalizations of distributed computation, expanding the ideas first imagined in MapReduce.
Spark is the first fast, general purpose distributed computing paradigm resulting from this shift and is gaining popularity rapidly. Spark extends the MapReduce model to support more types of computations using a functional programming paradigm, and it can cover a wide range of workflows that previously were implemented as specialized systems built on top of Hadoop. Spark uses in-memory caching to improve performance and, therefore, is fast enough to allow for interactive analysis (as though you were sitting on the Python interpreter, interacting with the cluster). Caching also improves the performance of iterative algorithms, which makes it great for data theoretic tasks, especially machine learning.
In this post we will first discuss how to set up Spark to start easily performing analytics, either simply on your local machine or in a cluster on EC2. We then will explore Spark at an introductory level, moving towards an understanding of what Spark is and how it works (hopefully motivating further exploration). In the last two sections we will start to interact with Spark on the command line and then demo how to write a Spark application in Python and submit it to the cluster as a Spark job.
Install Spark
Spark is pretty simple to set up and get running on your machine. I have a post (in Vietnamese) how to install Spark in Ubuntu 14.04, see there: https://blog.duyet.net/2015/03/bigdata-cai-at-apache-spark-tren-ubuntu.html
pyspark
After you source your profile (or simply restart your terminal), you should now be able to run a pyspark interpreter locally. Execute the pyspark command, and you should see a result as follows:
$ pyspark
Python 2.7.8 (default, Dec  2 2014, 12:45:58)
[GCC 4.2.1 Compatible Apple LLVM 6.0 (clang-600.0.54)] on darwin
Type "help", "copyright", "credits" or "license" for more information.
Spark assembly has been built with Hive, including Datanucleus jars on classpath
Using Sparks default log4j profile: org/apache/spark/log4j-defaults.properties
[… snip …]
Welcome to
      ____              __
     / __/__  ___ _____/ /__
    _\ \/ _ \/ _ `/ __/  `_/
   /__ / .__/\_,_/_/ /_/\_\   version 1.2.0
      /_/

Using Python version 2.7.8 (default, Dec  2 2014 12:45:58)
SparkContext available as sc.
>>>
At this point Spark is installed and ready to use on your local machine in "standalone mode." You can develop applications here and submit Spark jobs that will run in a multi-process/multi-threaded mode, or you can configure this machine as a client to a cluster (though this is not recommended as the driver plays an important role in Spark jobs and should be in the same network as the rest of the cluster). Probably the most you will do with Spark on your local machine beyond development is to use the spark-ec2 scripts to configure an EC2 Spark cluster on Amazon's cloud.
Minimizing the Verbosity of Spark
The execution of Spark (and PySpark) can be extremely verbose, with many INFO log messages printed out to the screen. This is particularly annoying during development, as Python stack traces or the output of print statements can be lost. In order to reduce the verbosity of Spark, you can configure the log4j settings in SPARK_HOME/conf/log4j.properties.template file, removing the ".template" extension.
$ cp $SPARK_HOME/conf/log4j.properties.template \
      $SPARK_HOME/conf/log4j.properties
Edit the newly copied file and replace INFO with WARN at every line in the code. You log4j.properties file should look similar to:
# Set everything to be logged to the console
log4j.rootCategory=WARN, console
log4j.appender.console=org.apache.log4j.ConsoleAppender
log4j.appender.console.target=System.err
log4j.appender.console.layout=org.apache.log4j.PatternLayout
log4j.appender.console.layout.ConversionPattern=%d{yy/MM/dd HH:mm:ss} %p %c{1}: %m%n

# Settings to quiet third party logs that are too verbose
log4j.logger.org.eclipse.jetty=WARN
log4j.logger.org.eclipse.jetty.util.component.AbstractLifeCycle=ERROR
log4j.logger.org.apache.spark.repl.SparkIMain$exprTyper=WARN
log4j.logger.org.apache.spark.repl.SparkILoop$SparkILoopInterpreter=WARN
Now when you run PySpark you should get much simpler output messages! Special thanks to @genomegeek who pointed this out at a District Data Labs workshop!
Using IPython Notebook with Spark
When Googling around for helpful Spark tips, I discovered a couple posts that mentioned how to configure PySpark with IPython notebook. IPython notebook is an essential tool for data scientists to present their scientific and theoretical work in an interactive fashion, integrating both text and Python code. For many data scientists, IPython notebook is their first introduction to Python and is used widely so I thought it would be worth including it in this post.
Most of the instructions here are adapted from an IPython notebook: Setting up IPython with PySpark. However, we will focus on connecting your IPython shell to PySpark in standalone mode on your local computer rather than on an EC2 cluster. If you would like to work with PySpark/IPython on a cluster, feel free to check out those instructions and if you do, please comment on how it went!
- Create an iPython notebook profile for our Spark configuration.
~$ ipython profile create spark
[ProfileCreate] Generating default config file: u'$HOME/.ipython/profile_spark/ipython_config.py'
[ProfileCreate] Generating default config file: u'$HOME/.ipython/profile_spark/ipython_notebook_config.py'
[ProfileCreate] Generating default config file: u'$HOME/.ipython/profile_spark/ipython_nbconvert_config.py
Keep note of where the profile has been created, and replace the appropriate paths in the following steps:
- Create a file in $HOME/.ipython/profile_spark/startup/00-pyspark-setup.py and add the following:
import os
import sys

# Configure the environment
if 'SPARK_HOME' not in os.environ:
    os.environ['SPARK_HOME'] = '/srv/spark'

# Create a variable for our root path
SPARK_HOME = os.environ['SPARK_HOME']

# Add the PySpark/py4j to the Python Path
sys.path.insert(0, os.path.join(SPARK_HOME, "python", "build"))
sys.path.insert(0, os.path.join(SPARK_HOME, "python"))
- Start up an IPython notebook with the profile we just created.
$ ipython notebook --profile spark
- In your notebook, you should see the variables we just created.
print SPARK_HOME
- At the top of your IPython notebook, make sure you add the Spark context.
from pyspark import  SparkContext
sc = SparkContext( 'local', 'pyspark')
- Test the Spark context by doing a simple computation using IPython.
def isprime(n):
    """
    check if integer n is a prime
    """
    # make sure n is a positive integer
    n = abs(int(n))
    # 0 and 1 are not primes
    if n < 2:
        return False
    # 2 is the only even prime number
    if n == 2:
        return True
    # all other even numbers are not primes
    if not n & 1:
        return False
    # range starts with 3 and only needs to go up the square root of n
    # for all odd numbers
    for x in range(3, int(n**0.5)+1, 2):
        if n % x == 0:
            return False
    return True

# Create an RDD of numbers from 0 to 1,000,000
nums = sc.parallelize(xrange(1000000))

# Compute the number of primes in the RDD
print nums.filter(isprime).count()
If you get a number without errors, then your context is working correctly!
Programming Spark
Programming Spark applications is similar to other data flow languages that had previously been implemented on Hadoop. Code is written in a driver program which is lazily evaluated, and upon an action, the driver code is distributed across the cluster to be executed by workers on their partitions of the RDD. Results are then sent back to the driver for aggregation or compilation. Essentially the driver program creates one or more RDDs, applies operations to transform the RDD, then invokes some action on the transformed RDD.
These steps are outlined as follows:
- Define one or more RDDs either through accessing data stored on disk (HDFS, Cassandra, HBase, Local Disk), parallelizing some collection in memory, transforming an existing RDD, or by caching or saving.
- Invoke operations on the RDD by passing closures (functions) to each element of the RDD. Spark offers over 80 high level operators beyond Map and Reduce.
- Use the resulting RDDs with actions (e.g. count, collect, save, etc.). Actions kick off the computing on the cluster.
When Spark runs a closure on a worker, any variables used in the closure are copied to that node, but are maintained within the local scope of that closure. Spark provides two types of shared variables that can be interacted with by all workers in a restricted fashion. Broadcast variables are distributed to all workers, but are read-only. Broadcast variables can be used as lookup tables or stopword lists. Accumulators are variables that workers can "add" to using associative operations and are typically used as counters.
Spark applications are essentially the manipulation of RDDs through transformations and actions. Future posts will go into this in greater detail, but this understanding should be enough to execute the example programs below.
Spark Execution
A brief note on the execution of Spark. Essentially, Spark applications are run as independent sets of processes, coordinated by a SparkContext in a driver program. The context will connect to some cluster manager (e.g. YARN) which allocates system resources. Each worker in the cluster is managed by an executor, which is in turn managed by the SparkContext. The executor manages computation as well as storage and caching on each machine.
What is important to note is that application code is sent from the driver to the executors, and the executors specify the context and the various tasks to be run. The executors communicate back and forth with the driver for data sharing or for interaction. Drivers are key participants in Spark jobs, and therefore, they should be on the same network as the cluster. This is different from Hadoop code, where you might submit a job from anywhere to the JobTracker, which then handles the execution on the cluster.
Writing a Spark Application Writing Spark applications is similar to working with Spark in the interactive console. The API is the same. First, you need to get access to the SparkContext, which was automatically loaded for you by the pyspark application.
A basic template for writing a Spark application in Python is as follows:
## Spark Application - execute with spark-submit


## Imports

from pyspark import SparkConf, SparkContext

## Module Constants

APP_NAME = "My Spark Application"

## Closure Functions


## Main functionality


def main(sc):
    pass

if __name__ == "__main__":
    # Configure Spark
    conf = SparkConf().setAppName(APP_NAME)
    conf = conf.setMaster("local[*]")
    sc   = SparkContext(conf=conf)

    # Execute Main functionality
    main(sc)
This template gives you a sense of what is needed in a Spark application: imports for various Python libraries, module constants, an identifying application name for debugging and for the Spark UI, closures or other custom operation functions, and finally, some main analytical methodology that is run as the driver. In our ifmain, we create the SparkContext and execute main with the context as configured. This will allow us to easily import driver code into the pyspark context without execution. Note that here a Spark configuration is hard coded into the SparkConf via the setMaster method, but typically you would just allow this value to be configured from the command line, so you will see this line commented out.
To close or exit the program use sc.stop() or sys.exit(0).
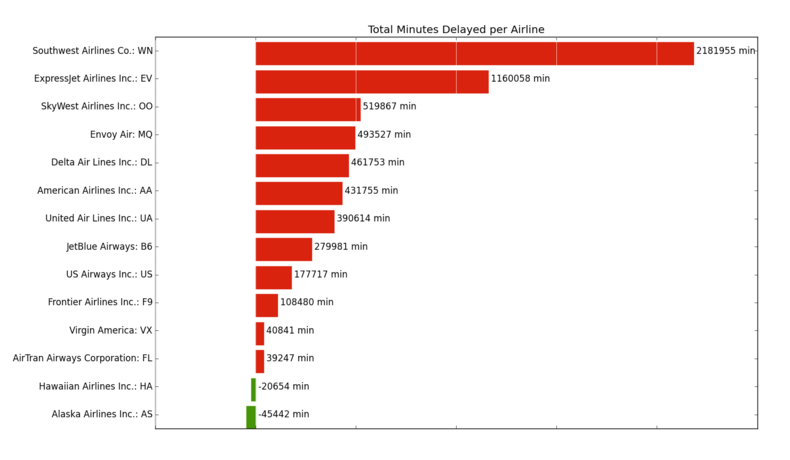
In order to demonstrate a common use of Spark, let's take a look at a common use case where we read in a CSV file of data and compute some aggregate statistic. In this case, we're looking at the on-time flight data set from the U.S. Department of Transportation, recording all U.S. domestic flight departure and arrival times along with their departure and arrival delays for the month of April, 2014. I typically use this data set because one month is manageable for exploration, but the entire data set needs to be computed upon with a cluster. The entire app is as follows:
## Spark Application - execute with spark-submit


## Imports

import csv
import matplotlib.pyplot as plt

from StringIO import StringIO
from datetime import datetime
from collections import namedtuple
from operator import add, itemgetter
from pyspark import SparkConf, SparkContext

## Module Constants

APP_NAME = "Flight Delay Analysis"
DATE_FMT = "%Y-%m-%d"
TIME_FMT = "%H%M"

fields   = ('date', 'airline', 'flightnum', 'origin', 'dest', 'dep',
            'dep_delay', 'arv', 'arv_delay', 'airtime', 'distance')
Flight   = namedtuple('Flight', fields)

## Closure Functions

def parse(row):
    """
    Parses a row and returns a named tuple.
    """

    row[0]  = datetime.strptime(row[0], DATE_FMT).date()
    row[5]  = datetime.strptime(row[5], TIME_FMT).time()
    row[6]  = float(row[6])
    row[7]  = datetime.strptime(row[7], TIME_FMT).time()
    row[8]  = float(row[8])
    row[9]  = float(row[9])
    row[10] = float(row[10])
    return Flight(*row[:11])

def split(line):
    """
    Operator function for splitting a line with csv module
    """
    reader = csv.reader(StringIO(line))
    return reader.next()

def plot(delays):
    """
    Show a bar chart of the total delay per airline
    """
    airlines = [d[0] for d in delays]
    minutes  = [d[1] for d in delays]
    index    = list(xrange(len(airlines)))

    fig, axe = plt.subplots()
    bars = axe.barh(index, minutes)

    # Add the total minutes to the right
    for idx, air, min in zip(index, airlines, minutes):
        if min > 0:
            bars[idx].set_color('#d9230f')
            axe.annotate(" %0.0f min" % min, xy=(min+1, idx+0.5), va='center')
        else:
            bars[idx].set_color('#469408')
            axe.annotate(" %0.0f min" % min, xy=(10, idx+0.5), va='center')

    # Set the ticks
    ticks = plt.yticks([idx+ 0.5 for idx in index], airlines)
    xt = plt.xticks()[0]
    plt.xticks(xt, [' '] * len(xt))

    # minimize chart junk
    plt.grid(axis = 'x', color ='white', linestyle='-')

    plt.title('Total Minutes Delayed per Airline')
    plt.show()

## Main functionality

def main(sc):

    # Load the airlines lookup dictionary
    airlines = dict(sc.textFile("ontime/airlines.csv").map(split).collect())

    # Broadcast the lookup dictionary to the cluster
    airline_lookup = sc.broadcast(airlines)

    # Read the CSV Data into an RDD
    flights = sc.textFile("ontime/flights.csv").map(split).map(parse)

    # Map the total delay to the airline (joined using the broadcast value)
    delays  = flights.map(lambda f: (airline_lookup.value[f.airline],
                                     add(f.dep_delay, f.arv_delay)))

    # Reduce the total delay for the month to the airline
    delays  = delays.reduceByKey(add).collect()
    delays  = sorted(delays, key=itemgetter(1))

    # Provide output from the driver
    for d in delays:
        print "%0.0f minutes delayed\t%s" % (d[1], d[0])

    # Show a bar chart of the delays
    plot(delays)

if __name__ == "__main__":
    # Configure Spark
    conf = SparkConf().setMaster("local[*]")
    conf = conf.setAppName(APP_NAME)
    sc   = SparkContext(conf=conf)

    # Execute Main functionality
    main(sc)
To run this code (presuming that you have a directory called ontime with the two CSV files in the same directory), use the spark-submit command as follows:
$ spark-submit app.py
This will create a Spark job using the localhost as the master, and look for the two CSV files in an ontime directory that is in the same directory as app.py. The final result shows that the total delays (in minutes) for the month of April go from arriving early if you're flying out of the continental U.S. to Hawaii or Alaska to an aggregate total delay for most big airlines. Note especially that we can visualize the result using matplotlib directly on the driver program, app.py:
So what is this code doing? Let's look particularly at the main function which does the work most directly related to Spark. First, we load up a CSV file into an RDD, then map the split function to it. The split function parses each line of text using the csv module and returns a tuple that represents the row. Finally we pass the collect action to the RDD, which brings the data from the RDD back to the driver as a Python list. In this case, airlines.csv is a small jump table that will allow us to join airline codes with the airline full name. We will store this jump table as a Python dictionary and then broadcast it to every node in the cluster using sc.broadcast.
Next, the main function loads the much larger flights.csv. After splitting the CSV rows, we map the parse function to the CSV row, which converts dates and times to Python dates and times, and casts floating point numbers appropriately. It also stores the row as a NamedTuple called Flight for efficient ease of use.
With an RDD of Flight objects in hand, we map an anonymous function that transforms the RDD to a series of key-value pairs where the key is the name of the airline and the value is the sum of the arrival and departure delays. Each airline has its delay summed together using the reduceByKey action and the add operator, and this RDD is collected back to the driver (again the number airlines in the data is relatively small). Finally the delays are sorted in ascending order, then the output is printed to the console as well as visualized using matplotlib.
This example is kind of long, but hopefully it illustrates the interplay of the cluster and the driver program (sending out for analytics, then bringing results back to the driver) as well as the role of Python code in a Spark application.
Conclusion
Although far from a complete introduction to Spark, we hope that you have a better feel for what Spark is, and how to conduct fast, in-memory distributed computing with Python. At the very least, you should be able to get Spark up and running and start exploring data either on your local machine in stand alone mode or via Amazon EC2. You should even be able to get iPython notebook set up and configured to run Spark!
Spark doesn't solve the distributed storage problem (usually Spark gets its data from HDFS), but it does provide a rich functional programming API for distributed computation. This framework is built upon the idea of resilient distributed datasets or "RDDs" for short. RDDs are a programming abstraction that represents a partitioned collection of objects, allowing for distributed operations to be performed upon them. RDDs are fault-tolerant (the resilient part) and, most importantly, can be stored in memory on worker nodes for immediate reuse. In memory storage provides for faster and more easily expressed iterative algorithms as well as enabling real-time interactive analyses.
Because the Spark library has an API available in Python, Scala, and Java, as well as built-in modules for machine learning, streaming data, graph algorithms, and SQL-like queries; it has rapidly become one of the most important distributed computation frameworks that exists today. When coupled with YARN, Spark serves to augment not replace existing Hadoop clusters and will be an important part of Big Data in the future, opening up new avenues of data science exploration.
Helpful Links
Hopefully you've enjoyed this post! Writing never happens in a vacuum, so here are a few helpful links that helped me write the post; ones that you might want to review to explore Spark further. Note that some of the book links are affiliate links, meaning that if you click on them and purchase, you're helping to support District Data Labs!
This was more of an introductory post than is typical for District Data Labs articles , but there are some data and code associated with the introduction that you can find here:
- Code on Github
- Shakespeare Dataset
- Airline On Time Dataset is munged from The Bureau of Transportation Statistics (US DOT)
Books on Spark
Helpful Blog Posts
- Setting up IPython with PySpark
- Databricks Spark Reference Applications
- Running Spark on EC2
- Run Spark and SparkSQL on Amazon Elastic MapReduce
Thanks again to districtdatalabs.