Big Data - Monitoring Spark with Graphite and Grafana
This post I have read from HammerLab, Contact me if Vietnamese version neccessary. In this post, they'll discuss using Graphite and Grafana to graph metrics obtained from our Spark applications to answer these questions
At Hammer Lab, we use Spark to run analyses of genomic data in a distributed fashion. Distributed programs present unique challenges related to monitoring and debugging of code. Many standard approaches to fundamental questions of programming (what is my program doing? Why did it do what it did?) do not apply in a distributed context, leading to considerable frustration and despair.
In this post, we’ll discuss using Graphite and Grafana to graph metrics obtained from our Spark applications to answer these questions.
Graphs of various metrics about the progress of a Spark application; read on for more info.
Spark Web UI
Spark ships with a Jetty server that provides a wealth of information about running applications:
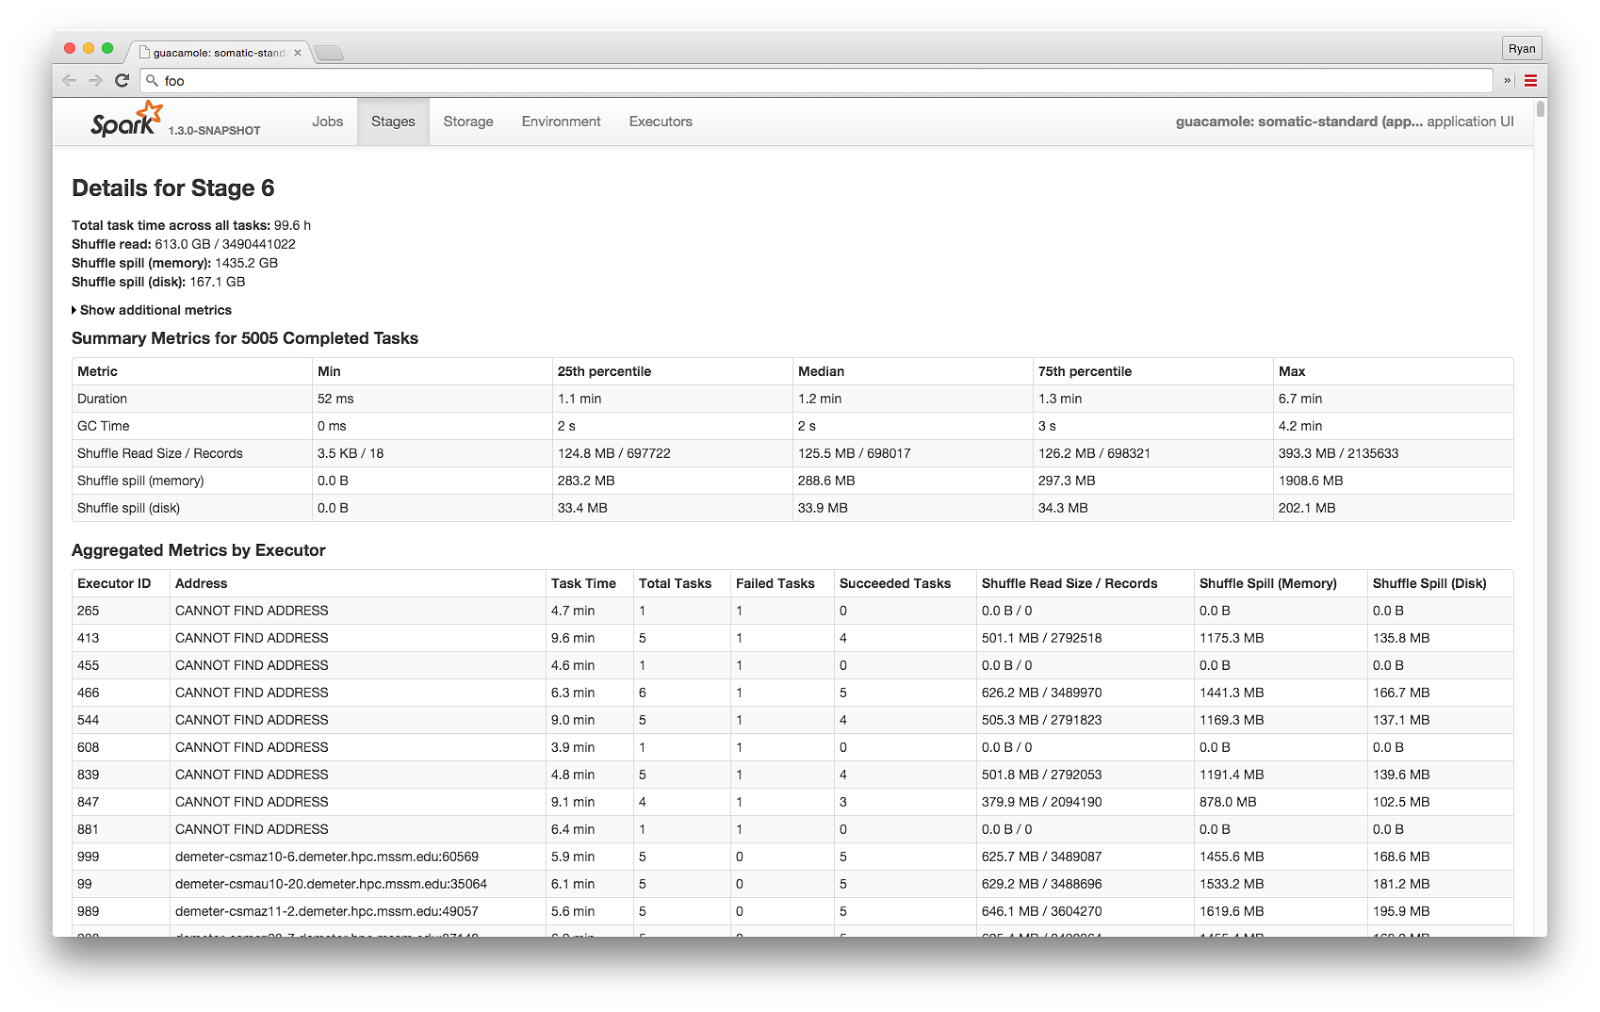
Here we see a page with information about a specific stage in a job: completed tasks, metrics per executor, and (below the fold) metrics per task.
This interface seems to be the way that most users interact with Spark applications. It gives a good overview of the state of an application and allows for drilling into certain metrics, such as bytes read from HDFS or time spent garbage collecting.
However, we hit issues with its ability to scale and its real-time experience. Recognizing that reasonable people can (and do!) disagree about subjective preferences related to such UIs, we sought a platform that better allowed us to experiment with ways to monitor our applications.
Enter: MetricsSystem
Buried in a rarely-explored corner of the Spark codebase is a component called MetricsSystem. A MetricsSystem instance lives on every driver and executor and optionally exposes metrics to a variety of Sinks while applications are running.
In this way, MetricsSystem offers the freedom to monitor Spark applications using a variety of third-party tools.
Graphite
In particular, MetricsSystem includes bindings to ship metrics to Graphite, a popular open-source tool for collecting and serving time series data.
This capability is discussed briefly in the Spark docs, but there is little to no information on the internet about anyone using it, so here is a quick digression about how to get Spark to report metrics to Graphite.
Sending Metrics: Spark → Graphite
Spark’s MetricsSystem is configured via a metrics.properties file; Spark ships with a template that provides examples of configuring a variety of Sources and Sinks. Here is an example like the one we use. Set up a metrics.properties file for yourself, accessible from the machine you’ll be starting your Spark job from.
Next, pass the following flags to spark-submit:
--files=/path/to/metrics.properties \
--conf spark.metrics.conf=metrics.properties
The --files flag will cause /path/to/metrics.properties to be sent to every executor, and spark.metrics.conf=metrics.properties will tell all executors to load that file when initializing their respective MetricsSystems.
Grafana
Having thus configured Spark (and installed Graphite), we surveyed the many Graphite-visualization tools that exist and began building custom Spark-monitoring dashboards using Grafana. Grafana is "an open source, feature rich metrics dashboard and graph editor for Graphite, InfluxDB & OpenTSDB," and includes some powerful features for scripting the creation of dynamic dashboards, allowing us to experiment with many ways of visualizing the performance of our Spark applications in real-time.
Examples # (#examples)
Below are a few examples illustrating the kinds of rich information we can get from this setup.
Task Completion Rate ## (#task-completion-rate)
These graphs show the number of active and completed tasks, per executor and overall, from a successful test of some toy read depth histogram functionality in a branch of our Guacamole variant calling project:

The leftmost panel shows close to 400 tasks in flight at once, which in this application corresponds to 4 "cores" on each of 100 executors. The "valley" in that leftmost panel corresponds to the transition between two stages of the one job in this application. The right two panels show the number of tasks completed and rate of task completion per minute for each executor.
HDFS I/O ## (#hdfs-io)
MetricsSystem also reports all filesystem- and HDFS-I/O at per-executor granularity. Below are some graphs showing us our application’s HDFS read statistics:

Clockwise from top left, we see:
- a peak of ~100 HDFS reads per second (red line, right Y-axis), with individual executors topping out around ~2/s over any given 10s interval (thinner multi-colored lines),
- a total of ~700 HDFS reads (red line, right Y-axis) over the application’s lifespan, with individual executors accounting for anywhere from ~20 to ~100,
- a total of ~180 GB of data read from HDFS (red line, right Y-axis), which is in line with what was expected from this job, and
- a peak total read throughput of around 1.5 GB/s.
Our applications are typically not I/O bound in any meaningful way, but we’ve nonetheless found access to such information useful, if only from a sanity-checking perspective.
JVM ## (#jvm)
The JVM statistics exported by Spark are a treasure trove of information about what is going on in each executor. We’ve only begun to experiment with ways to distill this data; here’s an example of per-executor panels with information about garbage collection:

Case Study: Ill-Fated SomaticStandard Run # (#case-study-ill-fated-somaticstandardsomaticstandard-run)
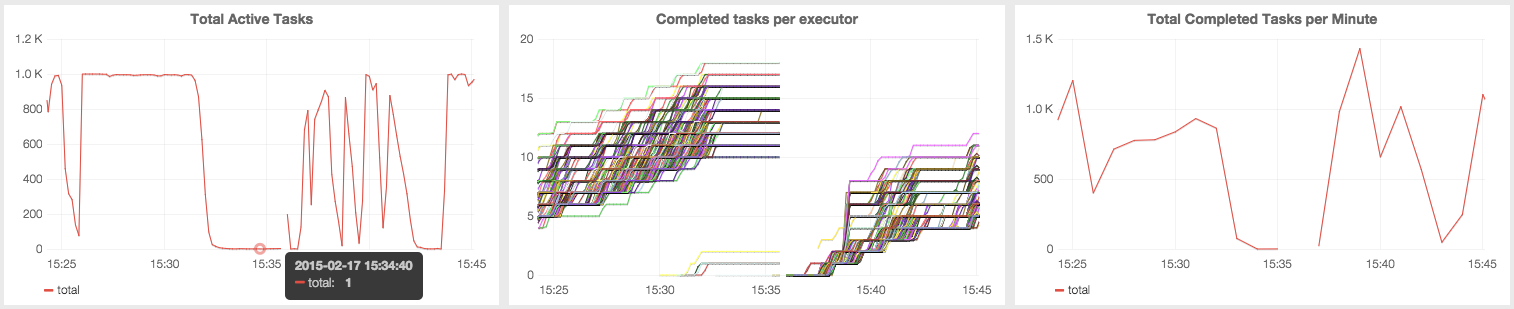
Let’s do some forensics on a recent failed run of our SomaticStandard variant caller and use our Grafana dashboard to diagnose an issue that proved fatal to the application. The graphs below, similar to those in the first example above, show the number of active and completed tasks, per executor and overall, during a period in the middle of the doomed application’s lifetime:

From experience, we have learned to note and infer several things from graphs like these:
-
All three graphs have a discontinuity toward the middle of the time window presented here.
-
This is likely due to the application master (AM) restarting.
-
Related: all "completed tasks per executor" (middle panel) counts restart from zero when the new AM spawns new executors.
-
In the lead-up to the discontinuity / AM restart, forward progress had almost completely stopped.
-
The tooltip on the left graph shows that there were several minutes where only one task (and therefore executor) was active (out of 1000 total executors).
-
The "completed task" counts in the right two graphs show no movement.
-
Finally, there are a suspicious couple of new lines starting from 0 in the middle graph around 15:31-15:32.
-
Why are executors coming to life this late in the application?
-
Answer: these new executors are replacing ones that have been lost.
-
Something during this flat-lined period is causing executors to die and be replaced.
Putting all of this information together, we conclude that the issue here was one of a "hot potato" task inducing garbage collection stalls (and subsequent deaths) in executors that attempted to perform it. This is a common occurrence when key skew causes one or a few tasks in a distributed program to be too large (relative to the amount of memory that has been allocated to the the executors attempting to process them). The study of skew in MapReduce systems dates back to the earliest days of MapReduce at Google, and it is one of the most common causes of mysterious Spark-job-degradation-or-death that we observe today.
grafana-spark-dashboards # (#grafana-spark-dashboards)
As usual, we’ve open-sourced the tools showcased here in the hopes that you’ll find them useful as well. The hammerlab/grafana-spark-dashboards repo contains a script that you should be able to use off-the-shelf to bootstrap your own slick Grafana dashboards of Spark metrics.
Future Work # (#future-work)
The development and standardization of sane tools for monitoring and debugging Spark jobs will be of utmost importance as Spark matures, and our work thus far represents only a tiny contribution toward that end. Though the grafana-spark-dashboards previewed above have been useful, there’s still an ocean of relevant data we would love to get out of Spark and onto our graphs, including but not limited to:
-
Structured information about jobs and stages, particularly start-/end-times and failures.
-
Information about what host each executor is running on.
-
Task- and record-level metrics!
-
Spark #4067 added such metrics to the web UI, and it would be great to be able to see them over time, identify executors / tasks that are lagging, etc.
-
Reporting task failures, even one-offs, would be useful; it is sometimes surprising to behold how many of those occur when perusing the logs.
In addition, supporting other time series database or metrics collection servers (e.g. StatsD, InfluxDB, OpenTSDB) would open up more avenues for users to monitor Spark at scale.
Thanks to Kostas Sakellis @ Cloudera, Andrew Johnson @ Etsy, Abe Stanway, and Torkel Ödegaard of Grafana/Raintank for their input though this process, and to the Spark team for manyrecentMetricsSystem-relatedcode reviews.
http://www.hammerlab.org/2015/02/27/monitoring-spark-with-graphite-and-grafana/